Retail Analysis
Welcome to my Retail Analysis Project, where I delve into a publicly available retail dataset through a comprehensive three-stage analysis. This project is aimed at extracting valuable insights and making data-driven predictions to enhance understanding of customer behavior and transaction patterns.
All the charts in this analysis were created using Python with the Seaborn and Matplotlib libraries.
You are welcome to review the code in my GitHub repository and find a detailed breakdown of my process below.
Overview
This project is structured into three key stages:
1. General Dataset Analysis:
Data Cleaning: The initial phase involves a thorough examination of the dataset to identify and handle missing values, duplicates, and other inconsistencies. This ensures that the data is clean and ready for analysis.
Exploratory Data Analysis (EDA): Various statistical and graphical techniques are applied to understand the distributions, relationships, and patterns within the data.
2. Clustering by Transaction Types:
Unsupervised Machine Learning: Utilizing advanced clustering algorithms, I identified 8 distinct clusters representing different transaction types. Each cluster is analyzed individually to understand its unique characteristics and behavior patterns.
3. Deep Learning Model for Customer Prediction:
Predictive Modeling: A deep learning model is developed to predict whether a customer will be regular or premium. This model achieves an impressive accuracy of 91% in predicting regular customers, showcasing its reliability and potential for real-world applications.
Explore the detailed analyses and results of each stage below to gain insights into the retail dataset and the powerful techniques employed in this project.
General Dataset Analysis
Exploration and Data Cleaning
The initial dataset comprised 302,010 rows and 30 columns. The first step involved a meticulous data cleaning process to ensure accuracy and reliability for subsequent analyses. This included removing null values, duplicates, and redundant transaction IDs, as well as eliminating columns containing sensitive information such as email, name, and address. After these steps, the dataset was refined to 280,216 rows and 24 columns.
Visualizing Key Distributions
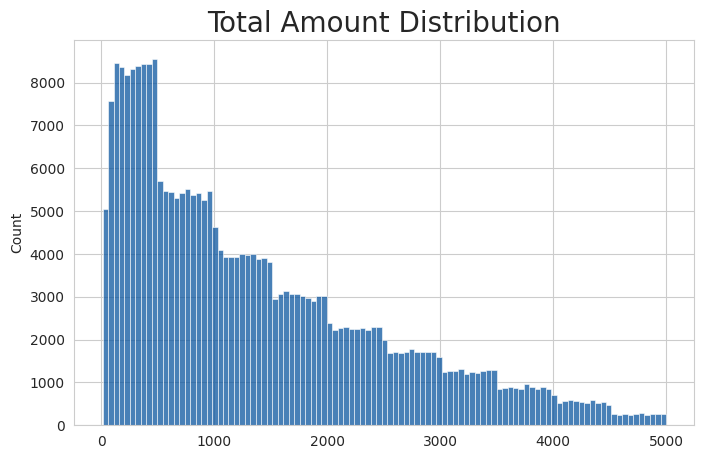
Total Amount Spent per Transaction:
- The total amount spent per transaction ranges from 0 to 5000, with a right-skewed distribution. The majority of transactions are concentrated between 0 and 1000, indicating that most customers tend to make smaller purchases.
Item Prices (Amount):
- The price distribution of individual items is uniform, spanning from 0 to 500. This suggests a wide variety of product prices without significant clustering at any specific price point.

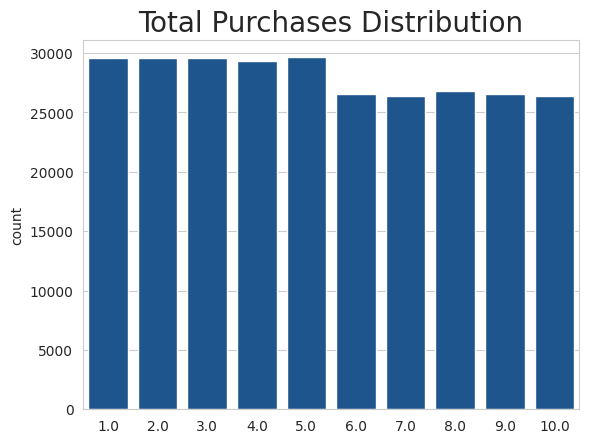
Total Purchases per Transaction:
- The number of products purchased per transaction varies from 1 to 10. The distribution is fairly uniform, with a slight drop after 5 products. This indicates that customers typically purchase a moderate number of items per transaction.
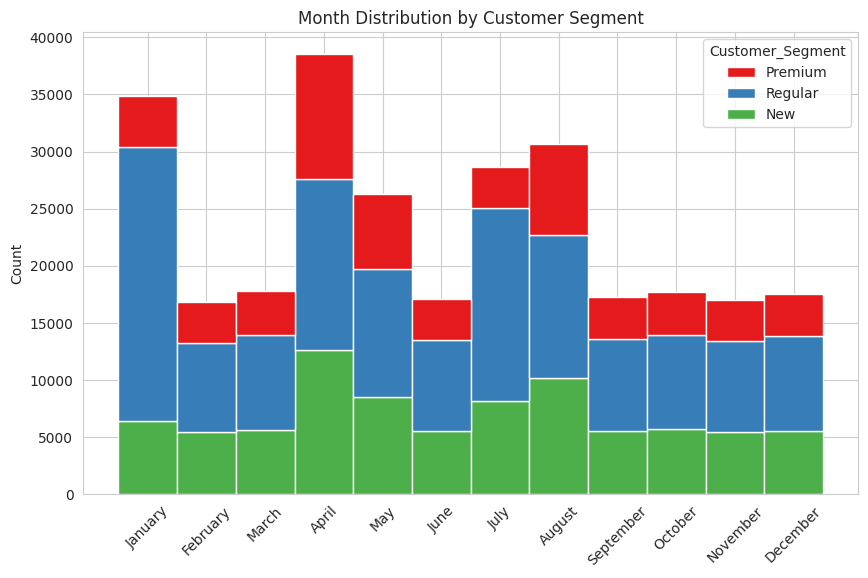
Monthly Order Distribution and Customer Segments
Analyzing the distribution of orders by month and examining the customer segments reveals several interesting trends:
Active Months:
- The most active months for orders are January, April, and August.
- In January, most orders are placed by regular customers.
- April sees a surge in new customer orders and a significant increase in premium customer purchases, possibly due to seasonal factors.
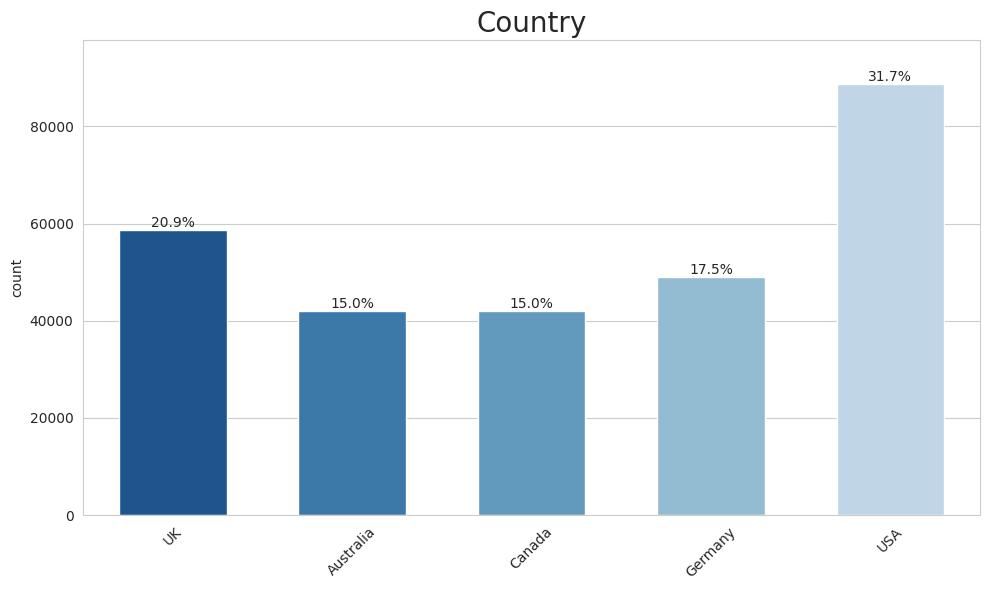
Geographical Insights:
- The majority of orders originate from the USA (31.7%), followed by the UK (20.9%), Germany, Canada, and Australia.
Demographic Insights:
- Gender: 62% of orders are placed by men.
- Income: The income distribution shows that 43% of customers are in the medium income category, followed by 32.8% in the low income category, and 25% in the high income category.


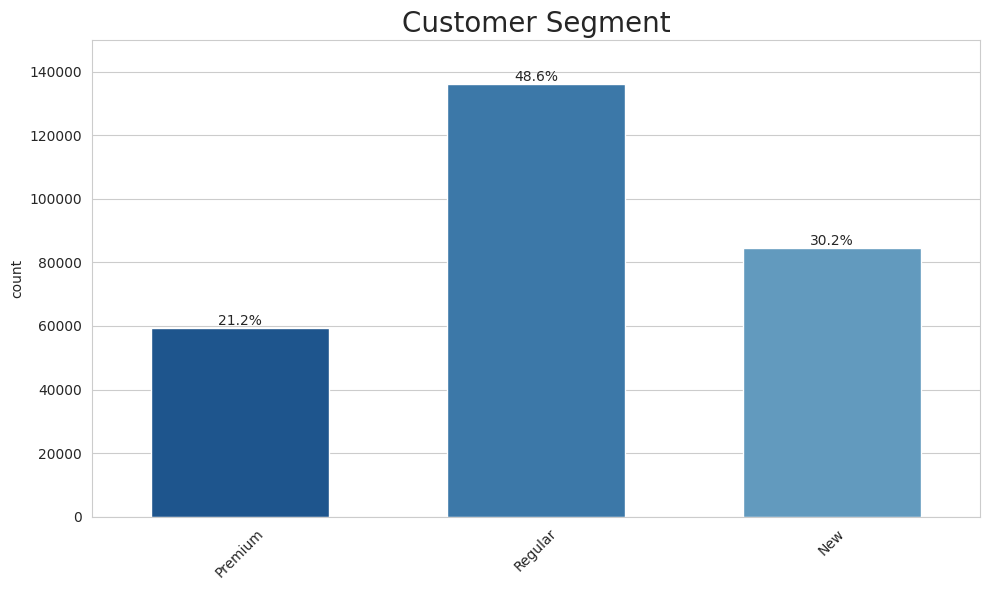
Customer Segments:
- Regular customers account for 48% of the orders, followed by new customers (30.2%) and premium customers (21.2%).
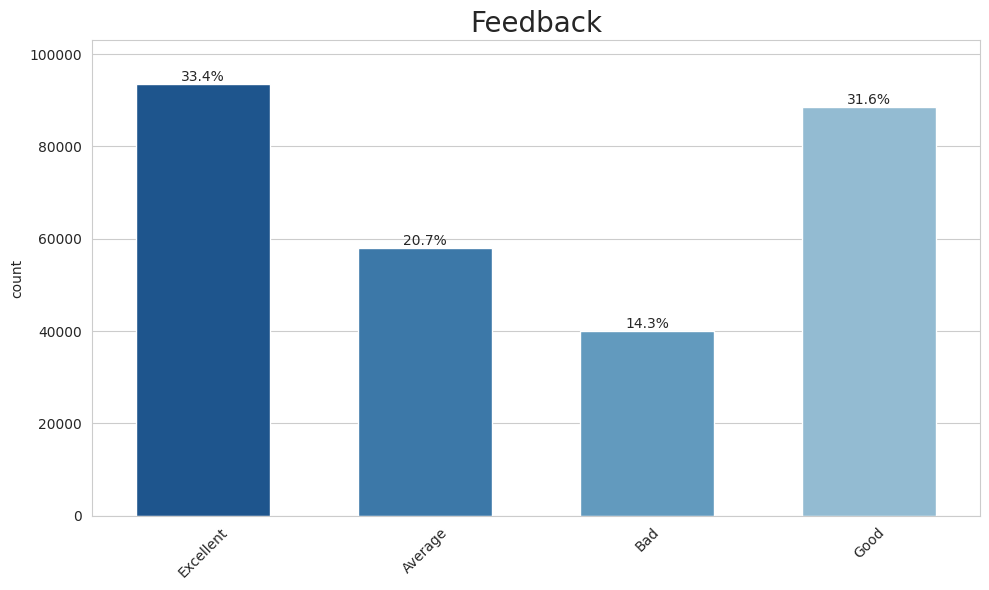
Feedback:
- Customer feedback is predominantly positive, with 33% rating their experience as excellent, 31% as good, 20% as average, and 14% as bad.
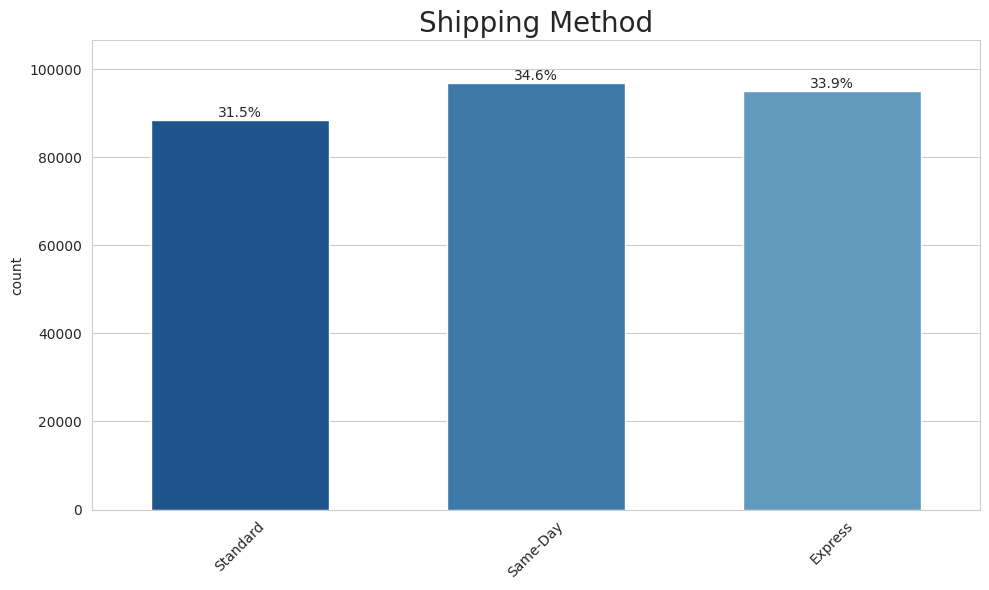
Shipping Methods:
- Orders are evenly distributed among standard, same-day, and express shipping methods.
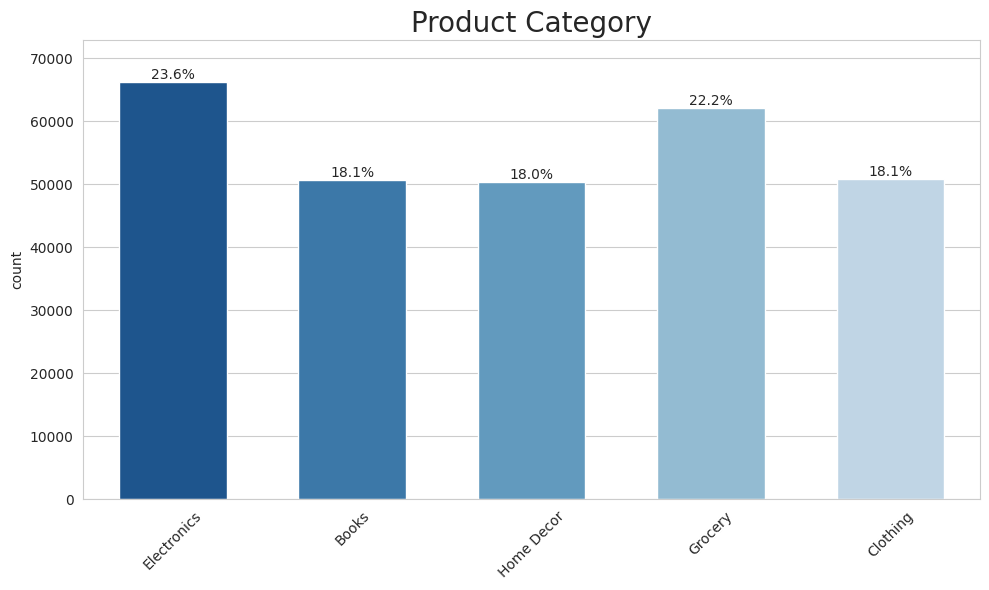
Product Categories:
- Electronics and grocery are the leading product categories, accounting for 23.6% and 22% of the orders, respectively.
Top Products and Brands
Detailed analysis of the top 10 product brands and types provides further insights:
Top Product Brands:
- Pepsi leads the brands, followed by Coca-Cola and HarperCollins.
- Notably, Pepsi includes a significant number of water products.

Top Product Types:
- Water is the most purchased product type, followed by smartphones and non-fiction books.

Monthly Insights for Top Product Brands and Types
Analyzing the top product brands and types for the three most active months (January, April, and August) highlights seasonal trends:
January:


- Top Product Brands: Whirlpool (28%), Pepsi, Nestle
- Top Product Types: Fridge (34%), Water, Smartphone
April:


- Top Product Brands: Mitsubishi (24.7%), Pepsi, Bluestar
- Top Product Types: Air conditioner (35.9%), Water, Smartphone
August:


- Top Product Brands: Pepsi (13.8%), Sony, Coca-Cola
- Top Product Types: Water (14.4%), Smartphone, Non-fiction
Visual analysis of Customer Segments
Visual Insights:


Country:
- The USA has the highest number of premium and new users, which aligns with the overall highest number of orders from this country.
- In Australia, Canada, and Germany, the distribution of orders among premium, regular, and new users is more uniform, showing less disparity between the segments compared to the USA.
Gender:
- There is no significant difference between customer segments and gender. The distribution of male and female customers is relatively balanced across all segments.
Income:
- An interesting insight is that most premium users are in the medium and low-income categories. This finding is somewhat unexpected, as premium users are often assumed to belong to higher income brackets.
Feedback:
- Premium users tend to give positive feedback, with the majority of them rating their experiences as excellent or good. This indicates a high level of satisfaction among premium customers.
Shipping Method:
- The distribution of shipping methods (standard, same-day, express) is quite similar across all customer segments, indicating no strong preference for any particular shipping method based on the segment.
Product Category:
- The distribution of product categories (e.g., electronics, grocery) is also similar across the three customer segments (regular, new, premium). This suggests that product preferences do not vary significantly between segments.
Analysis of Top Product Types by Month
In this final stage of the analysis, I focused on identifying the top 10 products by product type for the three most active months: January, April, and August. This detailed examination helps highlight the most popular products and potential seasonal trends.
Top Product Types and Their Insights:
January:


- Top Product Types: Fridge, Water, Smartphone
- Insights: The month of January shows a high demand for refrigerators, water, and smartphones. This indicates a preference for essential household appliances and popular consumer electronics during this period.
April:


- Top Product Types: AC (Air Conditioner), Water, Smartphone
- Insights: April sees a significant increase in the purchase of air conditioners, which can be attributed to the onset of warmer weather. The continued high demand for water and smartphones suggests consistent consumer interest in these categories.
August:


- Top Product Types: Water, Smartphone, Non-Fiction Books
- Insights: In August, water remains a top product type, likely due to ongoing high consumption. The demand for smartphones continues, while non-fiction books also emerge as a popular choice, indicating a possible trend towards educational and self-improvement reading during this time.
Global Conclusion and Strategic Decisions
Based on the comprehensive retail analysis presented on this website, several strategic decisions can be made to optimize business operations, marketing strategies, and customer engagement.
1. Data-Driven Inventory Management:
- Seasonal Product Planning: The analysis reveals that certain products such as refrigerators, air conditioners, and non-fiction books have peak demand during specific months. Businesses can use this information to plan inventory levels, ensuring sufficient stock during high-demand periods and avoiding overstock during off-peak times.
- Essential Goods Stocking: Consistent high demand for essential items like water and smartphones suggests the importance of maintaining robust inventory levels for these products throughout the year.
2. Targeted Marketing Strategies:
- Geographical Focus: The insights indicate that the USA is the leading market with the highest number of premium and new users. Marketing campaigns can be tailored to further strengthen this market while exploring potential growth opportunities in countries like Australia, Canada, and Germany, where the distribution of customer segments is more uniform.
- Customer Segment Engagement: With premium users predominantly providing positive feedback, businesses can focus on retaining these high-value customers through personalized marketing and loyalty programs. Additionally, strategies to convert regular and new customers into premium users could be explored.
3. Customer Demographic Insights:
- Income-Based Offers: The finding that most premium users belong to medium and low-income categories can guide the development of targeted promotions and offers that appeal to these income groups. This approach can help in attracting and retaining premium customers effectively.
- Balanced Gender Marketing: Given the balanced gender distribution across customer segments, marketing efforts should be inclusive, ensuring that campaigns resonate equally with both male and female customers.
4. Product and Service Enhancements:
- Feedback Utilization: The high levels of positive feedback from premium users indicate satisfaction with current products and services. Businesses should leverage this feedback to identify key drivers of satisfaction and replicate these factors across other customer segments.
- Shipping and Delivery Optimization: With the distribution of shipping methods being similar across all customer segments, businesses can focus on maintaining high standards of service for all shipping options, ensuring timely and reliable delivery.
5. Comprehensive Customer Insights:
- Segment-Specific Analysis: Detailed analysis of customer segments reveals unique preferences and behaviors. Businesses can use these insights to tailor their offerings and engagement strategies to meet the specific needs of each segment, enhancing overall customer satisfaction and loyalty.
- Regular Monitoring and Adaptation: Continuous monitoring of transaction patterns, customer feedback, and market trends is essential for adapting strategies in real-time. Regular updates to the analysis will ensure that businesses remain responsive to changing customer preferences and market conditions.